Portal for visualization of the Global Monitoring Plan is publicly available
Regional Centre of the Stockholm Convention in Brno - Research Centre for Toxic Compounds in the Environment (RECETOX) and Institute of Biostatistics and Analyses (IBA) Masaryk University, Czech Republic, have successfully finalized the development of the complex software and visualisation tool for global levels of the Stockholm Convention contained persistent organic pollutants in the atmosphere and human tissues (human milk and blood). Portal was launched on 22 February 2013.
The web site www.pops-gmp.org and its tools for visualization and analysis of data collected in the Global Monitoring Plan of the Stockholm Convention were approved by experts from the Secretariat of the Stockholm Convention, Global Coordination Group (GCG) and Regional Organization Groups (ROG) and made available to both environmental professionals and general public globally. Main users of the portal will be United Nations Environment Programme (UNEP), Parties to the Stockholm Convention as well as decision makers, scientists and general public.
The Global Monitoring Plan is an important component of the effectiveness evaluation of the Stockholm Convention (SC) and its main objective is assessment of long-term changes in POPs concentrations in core matrices – ambient air and human tissues (milk, blood). The first global data collection occurred in 2008 and the results were published in five regional monitoring reports available in PDF format. RECETOX was requested to perform detailed analysis based on the tasks indentified by the GCG in 2011 and prepare electronic tool in 2012; content of the analysis with regards to data structure, geographical coverage, time series availability and data reliability is summarized in the portal, section GMP reports analysis.
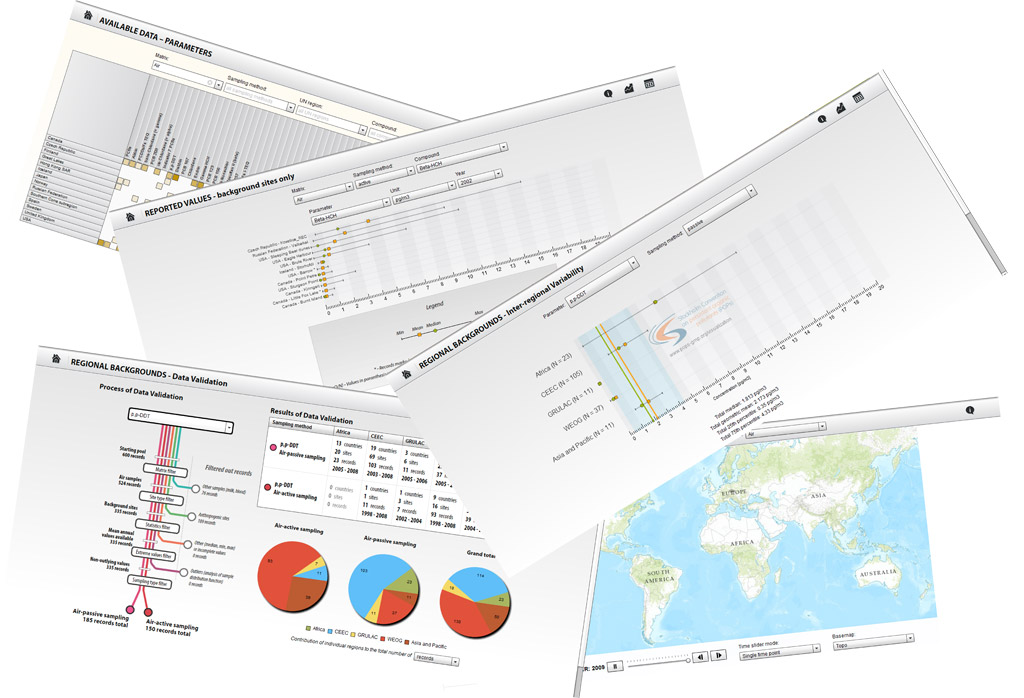
The GMP on-line data visualization is available in a module with additional data from other public sources, in particular from large environmental monitoring programmes, as some conclusions of the regional monitoring reports refer to them (EMEP, AMAP, IADN). The visualization comprises of three descriptive tools (geographic coverage in time and data availability according to individual compounds and years) and three analytical tools (values reported from background sites, demonstration of a 6-step validation of data from ambient air monitoring, and inter-regional variability in concentrations of selected compounds).
The outputs from the portal are available for download as graphic files (PNG format) or tables for MS Excel.
6.3.2013